Get Exposure to Millennials' Purchasing Power With This ETF

Millennials have been assigned a lot of blame, from spurring the downfall of paper napkins and bars of soap to turning their backs on mothballs and canned tuna fish. As a millennial myself, I shoulder some of that blame. While I still use napkins and bars of Dial soap, I haven’t opened a can of tuna fish since I left for college. And with respect to mothballs, frankly, they had it coming.
But as the country’s largest generational cohort at nearly 22% of the entire population—or more than 75 million Americans—millennials command enormous collective purchasing power. Understanding what the demographic chooses to spend its money on can provide insights into the industries and companies they support.
Enter the thematic Global X Millennials Consumer ETF (NASDAQ: MILN), a fund that tracks an index composed of U.S.-listed companies that derive a significant portion of their overall revenue from the spending habits of millennials.
An ETF Focusing on America’s Largest Generation
Global X launched MILN on May 4, 2016. Millennials now make up 45% of the workforce with most of their prime earning years ahead. That’s a key to the fund’s future success given how the U.S. economy is heavily reliant on consumer-driven behavior, with private consumption accounting for more than two-thirds of nominal GDP.
Global X states its goal is to invest in companies with a high likelihood of “benefitting from the rising spending power and unique preferences of the U.S. millennial generation.” Those companies span industries, including social media, entertainment, food/dining, clothing/apparel, health/fitness, travel, education, employment, housing, home goods, and financial services.
With millennials on track to spend an estimated $1.1 to $1.9 trillion in 2025—or approximately 27% to 28% of total U.S. retail spending—MILN looks to tap into the massive influence the generation wields. Since its inception, the ETF is up more than 233%, with 182% of that coming since its pandemic low in March 2020.
This year, the fund’s up more than 10%, but its portfolio composition suggests strong upside movement could occur through the end of the year and into 2026.
The smart money seems to agree. MILN’s short interest currently stands at just 0.33% of its float, a nearly 35% decrease monthly.
A Millennial-Approved Portfolio
The fund’s largest position is a lesser-known holding company with a big-time footprint. Sea Limited (NYSE: SE), which accounts for 3.94% of the portfolio, is a Singapore-based tech conglomerate that includes Shoppee, the largest e-commerce platform in Southeast Asia and Taiwan, digital payment and financial services firm Monee, and online gaming platform Garena.
Garena’s best-performing game is Free Fire, which has 33 million daily active users and around 120 million monthly active users.
From there, familiar names round out the ETF’s top five holdings, including:
- DoorDash (NASDAQ: DASH) with a 3.43% weighting
- Alphabet (NASDAQ: GOOGL) with a 3.40% weighting
- Walt Disney Stock (NYSE:DIS) with a 3.37% weighting
- Meta Platforms (NASDAQ: META) with a 3.35% weighting
One appealing part of MILN is that it is exceptionally well-balanced. No stock in its top 10 holdings currently exceeds 3.94% or falls below 3.09%, from Uber Technologies (NYSE: UBER) and Netflix (NASDAQ: NFLX) to Apple (NASDAQ: AAPL) and Spotify Technologies (NYSE: SPOT).
Meanwhile, given its consumer behavior-focused focus, its sector allocations are more concentrated, heavily favoring the consumer discretionary (42%), communication services (20.2%), and technology (16.1%) sectors. The only way this fund, which receives a Moderate Buy rating, could be more millennial is if avocado toast was its mascot. Of the 25 analysts covering MILN, it receives no Sell recommendations.
Strong Technical Setup
After setting its all-time high (ATH) in late September, MILN has pulled back and is currently sitting around 2% off of that mark. More short-term downside is likely until the ETF retests its 50-day exponential moving average (EMA), shown as the orange trendline in the one-year chart below.
When it tested that level the last three times (Arrows 1, 2, and 3 below), MILN bounced and moved higher.
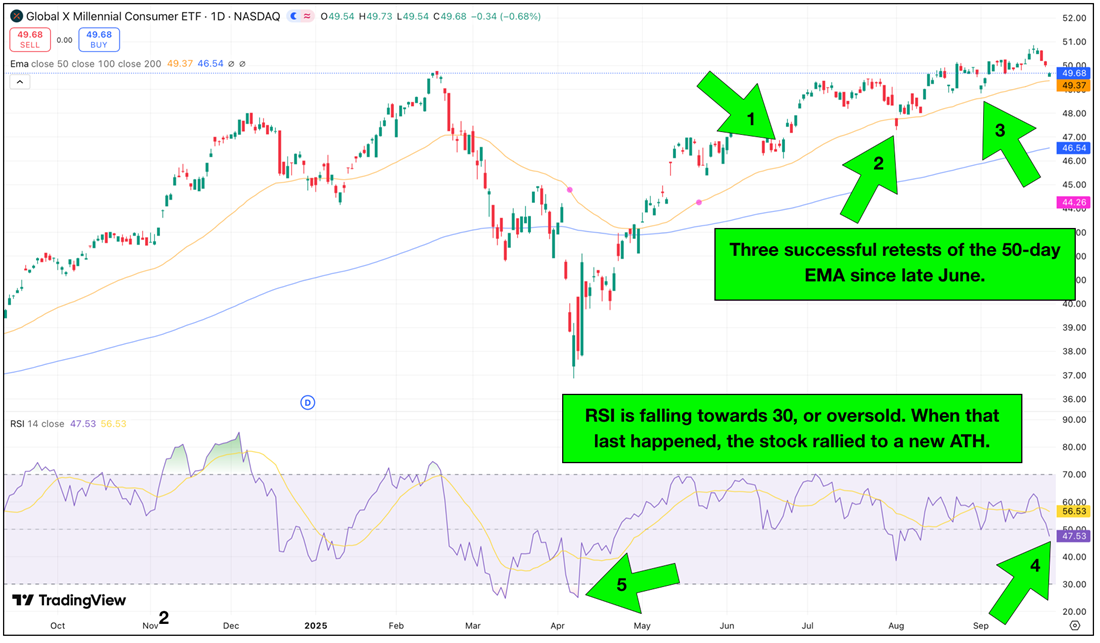
Another promising technical indicator is the fund’s Relative Strength Index (RSI), which currently reads 47.53. While that’s just below the median RSI threshold of 50, the indicator has shown a dramatic downside turn (Arrow 4 above), suggesting that it’s heading towards oversold territory.
The last time MILN’s RSI dropped into oversold territory (Arrow 5), buyers stepped in and pushed the ETF to its record high. If that trend continues, it could coincide with the retest of the 50-day EMA, causing shares to reverse, head higher, and potentially challenge MILN’s ATH before year’s end.
Learn more about MILN